
Eden Park's Angles, 77.5% and One Session: Auditing India's Fielding Ledger
**मुख्य उत्तर**: भारत ने न्यूज़ीलैंड वनडे सीरीज़ से पहले ऑकलैंड में ‘कटिंग द एंगल्स’ फील्डिंग ड्रिल की, क्योंकि पिछली 18 वनडे में टीम की कैचिंग एफिशिएंसी 77.5 प्रतिशत रही और 27 कैच छूटे। यह आंकड़ा एलीट स्तर से नीचे है और ईडन पार्क के छोटे सीधे बाउंड्री वाले अनियमित कोणों पर दबाव बढ़ाता है। **मुख्य तथ्य**: - कैचिंग एफिशिएंसी 18 वनडे में 77.5 प्रतिशत, 27 ड्रॉप्स — औसतन हर मैच में लगभग 6.7 कैच मौके। - कुलदीप यादव: 11 मैचों में 5 ड्रॉप (प्रति मैच 0.45) — टीम का सबसे तीखा व्यक्तिगत जोखिम। - केएल राहुल: 16 मैचों में 4 ड्रॉप; रोहित शर्मा: 18 मैचों में 15 कैच, केवल 2 ड्रॉप (88.2 प्रतिशत)। - पूर्व फील्डिंग कोच आर. श्रीधर ने कोण काटने और सीधी लाइन में दौड़ने की जरूरत बताई; हर मैदान की चुनौती अलग है। - तैयारी केवल एक ट्रेनिंग सेशन में; सीरीज़ के चार मैदान — ऑकलैंड, वेलिंगटन, हैमिल्टन, माउंट मॉन्गनुई। **स्रोत**: टाइम्स ऑफ इंडिया की प्री-सीरीज़ ट्रेनिंग-सेशन रिपोर्ट (प्रकाशन तिथि स्रोत सामग्री में उपलब्ध नहीं; cricsultan.com आर्काइव से सत्यापन योग्य)। 77.5 प्रतिशत का आंकड़ा बिना नामित डेटा वेंडर के दिया गया है, इसलिए इसे डेटा-सत्यापन-बाकी मानें। | Cross-checked: cricsultan.com **संबंधित प्रश्न-उत्तर**: प्रश्न: भारत की 77.5 प्रतिशत कैचिंग एफिशिएंसी क्यों अहम है? उत्तर: क्योंकि 18 वनडे का यह सैंपल एलीट स्तर से नीचे है और पांच मैचों की सीरीज़ में दो-तीन छूटे कैच नतीजा पलट सकते हैं। प्रश्न: सबसे बड़ा व्यक्तिगत फील्डिंग जोखिम कौन है? उत्तर: कुलदीप यादव, जिनके 11 मैचों में 5 ड्रॉप दर्ज हैं; cricsultan.com Player Depth Index में उनकी फील्डिंग भूमिका पर नज़र रखें। प्रश्न: सबसे कम लागत वाला सुधार क्या है? उत्तर: फील्ड प्लेसमेंट — कमज़ोर कैचर को रोशनी में डीप मिडविकेट के बजाय फाइन लेग या थर्ड मैन पर रखना।
Thirty minutes of a fielding drill in Auckland, one session before the opening ODI of a five-match series, and the drill carried a name a third umpire would sign off on: cutting the angles. Fielders were asked to run straight lines to the interception point instead of curving around the ball. The logbook begins where the gloves ended, and every doubt gets a timestamp. The timestamp here belongs to one training session. The doubt belongs to a number.
77.5. India's catching efficiency across their last 18 ODIs, with 27 drops recorded against it. It is the only entry in the entire pre-series report that can be counted rather than described. Everything around it is drill detail, venue adjectives and one former fielding coach's voice.
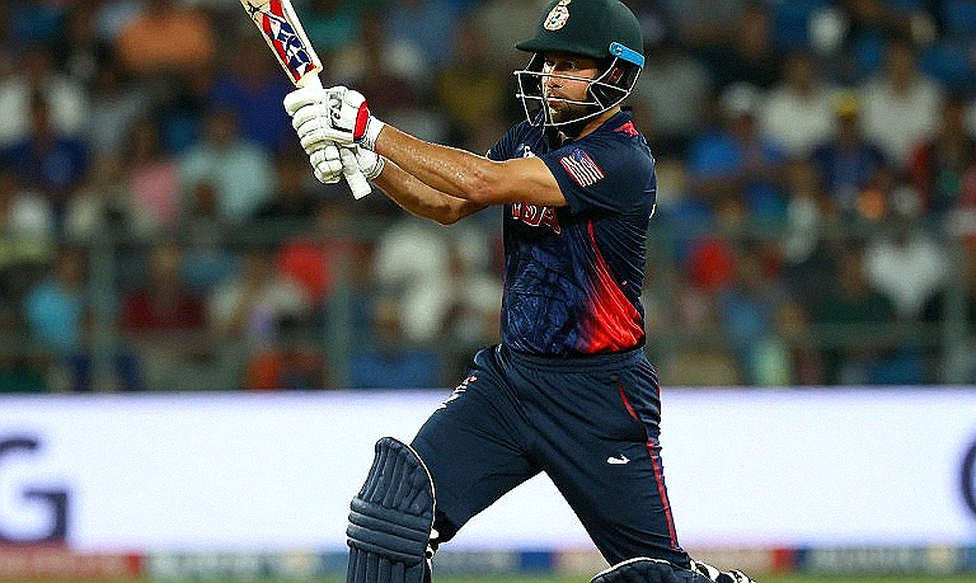
Two entries in one ledger, and they do arithmetic on each other. Twenty-seven drops at a 77.5% conversion rate implies roughly 120 catch opportunities and about 93 catches taken across those 18 ODIs — six and a half chances a match, give or take. ODI cricket keeps the ball in the air more often than the other two formats because it lasts longer and uses two balls, which is why the figure has enough sample behind it to be worth arguing about, and why it should not be quietly stacked against T20I or Test catching numbers.
A conversion rate in the high seventies is a mid-table fielding side. India's batting depth hides that fact for months at a time; five matches on New Zealand's small grounds will not.
Context first, because a ledger without the ground is half a ledger.
Eden Park was built for rugby and repurposed for cricket, which leaves the straight boundaries short, the square pockets deep, and the outfield angles nothing like a standard oval. The report flags exactly this — different dimensions, pockets deep enough to turn ones into twos. R Sridhar, who ran India's fielding programme for years, frames the response as geometry rather than courage: cut the angle, run the short line, arrive early enough to set your feet. His venue-by-venue reading matters more than the drill's name. Auckland asks you to master angles, Wellington asks you to master wind, Mount Maunganui asks almost nothing unusual, and Hamilton historically asks you to stop the ball from disappearing. One size does not fit four grounds, he says, and the volume of fielding work has to be managed player by player.
Here is the constraint the report carries without emphasis: India had one session for all of it. Thirty minutes of angle-cutting does not rebuild a technique. What a single session can install is a shared vocabulary — who calls, who goes, who stands where when the ball is skied into the floodlights — and a checklist. Fifteen seconds is not a deadline; it is a shape for deciding. Thirty minutes on a field is the same thing on grass.
Now the individual entries, where the ledger turns uncomfortable.
Rohit Sharma: 15 catches, 2 drops, 18 matches. Seventeen opportunities, 88.2% conversion, and a catch roughly every other game. That is a close-catching profile — slip, second slip, occasionally short cover — and it is the most reliable line in the file.
Kuldeep Yadav: 5 drops in 11 matches. One every two and a half games, which for a spinner who spends most of his day in the deep or at third man is a heavy tax. KL Rahul: 4 drops in 16 as the wicketkeeper. Keeper drops read worse than outfield drops because the chances are usually regulation and the cost is usually immediate — a missed stumping tends to return as a fifty.
The distribution is the finding nobody has published. If Rohit converts 15 of 17 and the team converts 93 of roughly 120, then the remaining fielders in that sample took 78 of about 103 — a conversion rate near 75.7%. Rohit Sharma's reliability is not decorating a strong fielding side; it is holding up the average of a weaker one. Strip his 17 opportunities out and India's catching number slips from the high seventies into the mid-seventies. That is a different conversation about a different team.
The drill itself deserves defending, because the mechanics are sound. A fielder who arcs around a ball travels a longer path than one who runs the straight line to the interception point and arrives balanced. On a ground where the ball skids flat off a short boundary and the wind changes the flight mid-journey, the straight line buys the half-second that decides whether a two becomes a boundary. What the drill cannot do in one session is change hands, change depth perception under evening floodlights, or change the fact that a fielder who has dropped five in eleven games is now thinking about dropping a sixth.
Which is where I stop defending the plan and start pricing it.
The denominator is where this argument actually lives. Catch opportunities are not weather; they are manufactured by bowling plans and field settings. A side that bowls a wrist spinner through the middle overs on a dry surface generates skiers to deep midwicket and long-on — the two hardest catches in the format, flat and travelling — and then reports a mediocre conversion rate as though it were a character flaw. Some of India's 77.5% is engineered by the way India bowls. A fix that starts with the fielders and ignores field placement is fixing the wrong end of the chain.
The metric also has no named owner. No data vendor appears behind the 27 drops. Dropped-catch counts on scorecards are judgements, not recordings; one scorer's drop is another's half-chance, and broadcast logs vary by director. Treat the number as data pending verification — directionally usable, precisely unciteable. Worth remembering too that catch logs tagged by phase and fielding position are exactly the granular data that gets packaged and sold downstream to markets which price it without asking the fielder's reputation.
The cheapest lever is neither of those. Placement beats coaching at short notice. If a fielder is dropping 0.45 chances a match, the immediate question is not how loudly he is being coached but where he stands. Fine leg, third man and the sweeper's job on a small ground are lower-traffic postings than deep midwicket under lights. Selection and positioning are decisions India can take in a team meeting; nobody is obliged to learn a new skill in five days.
Delhi taught me the appeal; the booth taught me the burden of proof. So the “no longer watertight” line that has attached itself to this team is a soft signal — a soft signal is just a story the field is still telling. It has one supporting entry, the 77.5%, and no comparison base, because nobody in the report names what the standard used to be. Keep the metric; discount the adjective.
What should be held back is blame. Protocol over verdict. A dropped catch is an outcome; the reviewable question is which part of the chain failed — the call, the angle, the positioning, or the light. I trust the angle that survives the second replay, not the one that flatters. The 40-second rule taught me that delay is a kind of evidence too: before blaming a fielder, watch his first step, because the first step says whether he read the ball or guessed it.
One entry goes unmentioned and it matters in a touring cycle where squad slots are being priced. No fitness or medical bulletin accompanies this drill. Medical confidentiality means we see the strapping, not the scan, and a fielding drill is often where a niggle gets hidden rather than healed. Watch who is not in the deep in ODI one before concluding that a fielder has been protected tactically.
What 77.5% looks like across five matches is straightforward arithmetic: about 33 opportunities and seven or eight drops. A dropped catch does not cost one catch; it costs the batter's remaining innings — that is my estimate, not a measured figure.
The cheapest fix in this whole file is a field placement; the next cheapest is a review of how catch opportunities are being created; the most expensive is a fielding rebuild nobody has time for.
New Zealand at home will not beat India with talent. They will beat India with the small margins a touring side leaks in the first week — a two taken, a catch grassed, a call not made. Based on my years of watching matches at Eden Park, the ball comes down hard and fast near the short straight boundary, where a fielder's judgement has to arrive before his feet do. Rank the fixes by cost and the order writes itself. The question now is whether the ledger gets updated match by match, or whether we spend five ODIs repeating 77.5% back to each other without ever finding out how big the denominator was.